
Gold Market Forecast Today: Shocking Trends Ahead Revealed in 2026
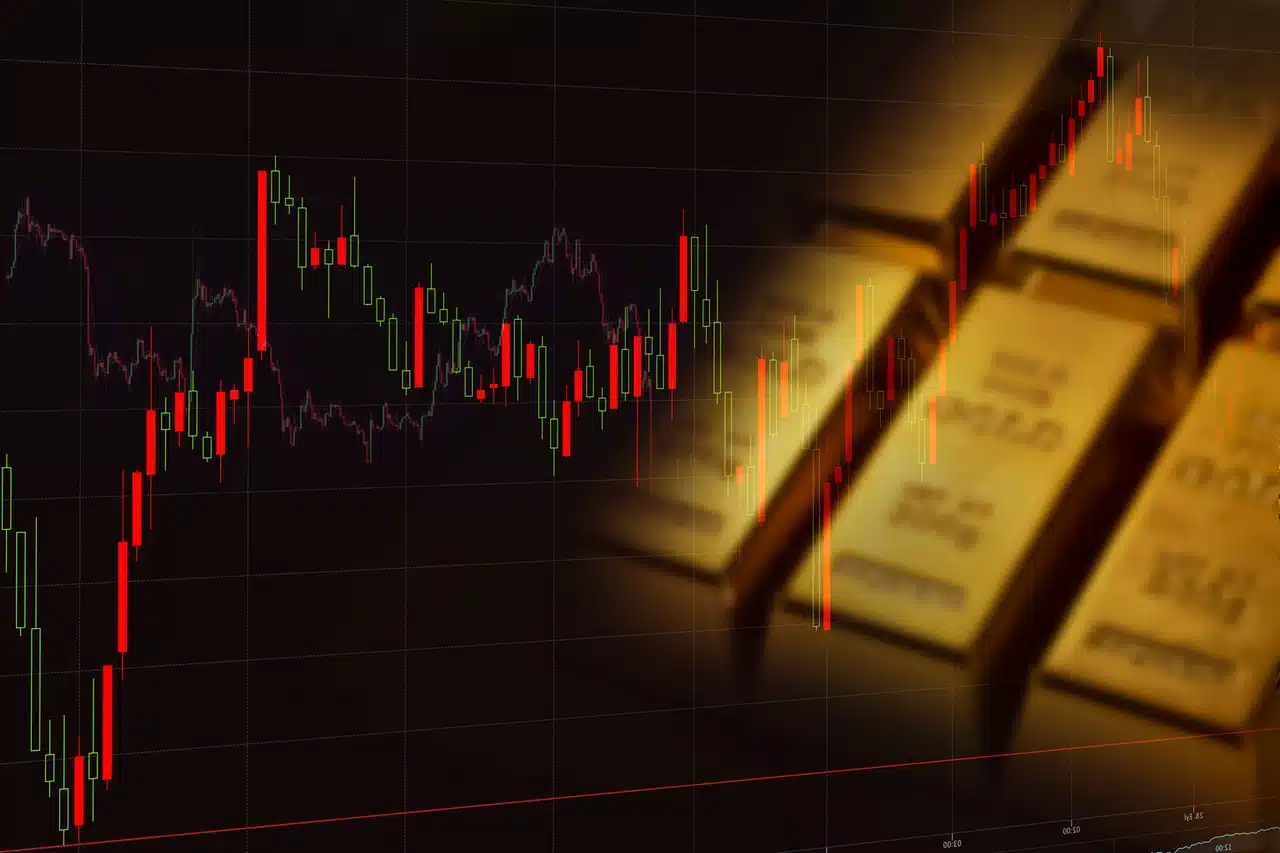
Gold Market Forecast Today: As of February 23, 2026, the spot price of gold hovers around $5,150 per troy ounce, marking a remarkable ascent from the sub-$3,000 levels seen just a few years ago.
This surge isn’t mere speculation; it’s a reflection of gold’s enduring role as a safe-haven asset in an era of unprecedented economic volatility.
Investors and central banks alike are turning to gold to hedge against risks, making accurate forecasts essential for anyone navigating portfolios, retirement plans, or even everyday savings.
Why do these predictions matter? In a world where stock markets fluctuate wildly due to policy shifts and global events, gold’s trajectory can signal broader economic health—or impending turmoil.
A well-informed forecast could mean the difference between capitalizing on a bull run or missing out on substantial gains, especially as gold has already risen over 70% in the past year alone.
For businesses in jewelry, electronics, or mining, it influences supply chains and pricing strategies. For individual investors, it guides decisions on whether to buy physical bars, ETFs, or mining stocks amid rising costs of living.
At the heart of the 2026 gold market are several intertwined drivers propelling prices upward. Inflation remains a persistent force, with global rates stubbornly above central bank targets despite aggressive monetary tightening in prior years.
The U.S. Federal Reserve’s anticipated two to three rate cuts this year could weaken the dollar further, traditionally boosting gold’s appeal as an alternative store of value.

Geopolitical tensions add fuel to the fire: Escalating U.S.-Iran nuclear standoffs, ongoing U.S.-China trade frictions, and renewed tariff threats under the current administration have investors flocking to safe havens.
Central bank demand is another powerhouse, with sovereign purchases projected at 800 tons annually, decoupling gold from traditional dollar dynamics and underscoring a structural shift toward diversification away from fiat currencies.
Supply-side constraints exacerbate this: Aging mines and environmental regulations are limiting output, creating a supply-demand imbalance that favors higher prices.
Investor sentiment, too, plays a role, with retail and institutional flows surging amid fears of recession or AI-driven market disruptions.
Our thesis is clear: Gold could easily surpass $6,000 per ounce in 2026 amid these mounting uncertainties, potentially climbing higher in extreme scenarios like deepened conflicts or economic downturns.
This isn’t hyperbole; it’s grounded in data showing gold’s resilience during crises, from the 2008 financial meltdown to the COVID-19 pandemic.
Teasing what’s ahead, major financial institutions are aligning on bullish outlooks. JPMorgan forecasts gold reaching $6,300 by year-end, driven by sustained central bank buying and investor diversification.
Goldman Sachs, while more conservative, sees $5,400 by December, emphasizing volatility but upside risks from geopolitical flares.
UBS joins the chorus with a $6,200 target by mid-year, citing stronger-than-expected demand and potential for $7,200 in a high-tension environment.
These expert insights set the stage for a deeper dive into historical trends, detailed predictions, and actionable strategies to help you position yourself in this glittering market.
Historical Context: Gold’s Performance Leading into 2026
To grasp the potential trajectory of gold in 2026, it’s essential to examine its performance from 2020 to 2025—a period marked by extraordinary volatility and a staggering overall ascent.
Gold entered 2020 at around $1,518 per ounce, amid early signs of global economic strain from the emerging COVID-19 pandemic.
By year’s end, it had surged to $1,898, reflecting a 25% annual gain as investors sought refuge in safe-haven assets during lockdowns and unprecedented fiscal stimulus.
The momentum waned in 2021, with gold closing at $1,829 after a -4% dip, as post-vaccine recovery optimism and rising interest rates tempered enthusiasm.
The landscape shifted dramatically in 2022, starting at $1,829 and ending at $1,824, essentially flat with a -0.3% change. This stagnation occurred against the backdrop of the Russia-Ukraine war erupting in February, which initially spiked prices to over $2,000, but aggressive Federal Reserve rate hikes to combat inflation—peaking at 9.1% in the U.S.—strengthened the dollar and pressured gold downward.
In 2023, gold rebounded to close at $2,062, up 13%, fueled by ongoing geopolitical tensions, including escalations in the Middle East, and banking sector wobbles like the Silicon Valley Bank collapse, which renewed safe-haven demand.
By 2024, gold’s bull run accelerated, opening at $2,064 and closing at $2,625, a 27% rise. Key drivers included anticipated Fed rate cuts starting mid-year, persistent inflation above targets, and heightened U.S.-China trade frictions.
The real fireworks came in 2025, with gold skyrocketing from $2,625 to $4,337 by year-end—a whopping 65% increase, often cited as around 70% in rounded terms due to intra-year peaks nearing $4,550.
This explosive growth was propelled by deepened global uncertainties, including renewed tariff wars, AI-driven market disruptions, and record central bank purchases exceeding 1,000 tons annually.
These key events—COVID recovery phases, the Russia-Ukraine conflict’s prolonged impact, and Fed policy pivots from hikes to cuts—underscore gold’s sensitivity to macroeconomic and geopolitical shocks.
The pandemic’s stimulus flooded markets with liquidity, inflating asset prices; the war disrupted supply chains and energy markets, stoking inflation; and rate cuts weakened the dollar, making gold more attractive.
For a clearer comparison, here’s a table of annual average prices and percentage changes:
| Year | Annual Average (USD/oz) | Year-End Close (USD/oz) | Annual % Change |
|---|---|---|---|
| 2020 | $1,771 | $1,898 | +25% |
| 2021 | $1,799 | $1,829 | -4% |
| 2022 | $1,802 | $1,824 | -0.3% |
| 2023 | $1,944 | $2,062 | +13% |
| 2024 | $2,408 | $2,625 | +27% |
| 2025 | $3,448 | $4,337 | +65% |
| 2026 (Forecast) | $4,981+ | N/A | +18% (YTD) |
This data highlights gold’s transition from consolidation to a multi-year bull market, with 2025’s surge pushing averages well above $3,000—far exceeding earlier decades.
Lessons from past bull markets are instructive: The 1970s saw gold rise 2,300% amid stagflation and oil shocks, teaching that persistent inflation erodes fiat currencies.
The 2000s bull run (up 600% post-dot-com bust and financial crisis) showed gold thrives in low-rate environments and credit crunches.
Similarly, 2020-2025 echoes these, with central banks’ balance sheet expansions and de-globalization trends favoring long-term holdings over short-term trades.
Investors should view dips as entry points, diversify to mitigate volatility, and monitor dollar strength—patterns that position 2026 for continued upside if uncertainties persist.

Key Drivers Influencing the 2026 Gold Market
The gold market in 2026 appears positioned for sustained momentum, driven by a powerful mix of macroeconomic pressures, geopolitical tensions, and structural supply constraints.
Unlike traditional commodities that rely heavily on industrial demand, gold’s valuation is increasingly shaped by its role as a monetary hedge, portfolio diversifier, and safe-haven asset during systemic uncertainty.
With prices stabilizing above $5,000 per ounce in early 2026, major institutions such as J.P. Morgan project average prices near $5,000 by year-end, with bullish scenarios reaching $6,300.
Understanding the forces behind this outlook is essential for investors navigating heightened volatility.
1. Macroeconomic Forces: Inflation, Dollar Weakness & Rate Cuts
Macroeconomic dynamics remain the foundation of gold’s 2026 trajectory.
Inflation pressures persist, with U.S. core PCE hovering around 2.5–3%, despite cooling from 2025 peaks. This sustains concerns around currency debasement, reinforcing gold’s appeal as a store of value.
A weakening U.S. dollar — down approximately 5% against major currencies since late 2025 — further strengthens gold’s attractiveness to international buyers. Historically, similar USD declines have correlated with 10–15% gold price appreciation.
Interest rate policy is equally pivotal. The Federal Reserve is expected to deliver 2–3 rate cuts in 2026, potentially bringing the federal funds rate down to 3.5–4%. Lower rates reduce the opportunity cost of holding non-yielding gold, typically supporting price gains.
If GDP growth slows below 2%, rate cuts could accelerate. According to modeling from the World Gold Council, such a scenario could generate 5–15% additional upside. Conversely, stronger-than-expected growth may temper gains by strengthening the dollar.
2. Geopolitical Risk: Persistent Safe-Haven Demand
Geopolitical instability remains a powerful catalyst for safe-haven flows.
Ongoing conflicts in Ukraine and the Middle East, combined with escalating U.S.–China tensions over trade and technology restrictions, continue to fuel uncertainty.
Expanding trade wars — with new tariffs potentially adding 0.5–1% to global inflation — are also accelerating de-dollarization efforts among sovereign nations.
Russia’s asset freezes in recent years have prompted central banks to diversify reserves away from dollar-denominated assets. These forces played a major role in 2025’s rally and could drive 10–20% price surges under high-risk escalation scenarios.
3. Central Bank Buying: A Structural Tailwind
Central bank accumulation remains one of gold’s strongest structural supports.
Purchases are projected at approximately 190 tonnes per quarter, contributing to a broader 585-tonne quarterly demand average including investor flows.
Institutions such as China’s PBOC and India’s RBI continue reserve diversification amid rising U.S. debt levels exceeding $35 trillion.
This sustained accumulation trend has increasingly decoupled gold from traditional economic cycles. Analysts estimate that for every 100 tonnes above baseline demand, gold prices may gain roughly 2% per quarter.
This structural demand appears ongoing and far from exhausted.
4. Investor Sentiment & Portfolio Reallocation
Investor behavior is shifting decisively toward defensive positioning.
The S&P 500’s rising correlation with bonds — now near 30-year highs — has weakened traditional diversification benefits. As a result, gold’s low correlation with equities (historically under 0.2) has renewed its appeal in portfolio construction.
ETF inflows surged 275 tonnes annually in 2025, while retail bar and coin demand reached 330 tonnes per quarter. Concerns about recession risks, elevated valuations, and AI-driven labor disruptions have reinforced gold’s defensive allocation case.
Momentum also plays a role: following a 65% price increase in 2025, trend-following capital continues to reinforce upward pressure.
5. Supply Constraints: A Tightening Market
On the supply side, structural constraints are becoming increasingly visible.
Global mine production is plateauing near 3,700 tonnes annually, with projected growth of just 1–2% in 2026 before potential contraction by 2028. Ore grades have fallen by roughly 50% since 1990, while major producers are replacing less than half of annual depletion.
This creates a structural deficit of approximately 1,300 tonnes, partially filled by recycling — a source that remains price-sensitive and slow to respond to sudden demand spikes.
Rising all-in sustaining costs (AISC) above $1,500 per ounce, alongside stricter environmental regulations and longer permitting timelines, further constrain new supply — reinforcing the case for structurally higher prices.
Outlook: A Resilient but Volatile Bull Market
Taken together, these drivers point toward a resilient 2026 bull market for gold. Persistent inflation, monetary easing, geopolitical tensions, central bank diversification, and constrained supply form a powerful multi-layered support system.
However, risks remain. A rapid global economic recovery or unexpectedly hawkish monetary policy could limit upside momentum.
For investors, close monitoring of Federal Reserve policy decisions, inflation data, and geopolitical developments will be critical in assessing gold’s trajectory through 2026.

Expert Predictions and Price Forecasts for 2026
As gold consolidates above $5,100 per ounce in early 2026, expert predictions for the remainder of the year reveal a wide spectrum of optimism, tempered by caution over economic variables.
Financial institutions and analysts have ramped up their forecasts amid persistent central bank buying, geopolitical tensions, and anticipated Federal Reserve rate cuts, but divergences highlight risks like a stronger U.S. dollar or rapid economic recovery.
This section synthesizes views from major banks and polling data, offering a balanced outlook to guide investors. While no forecast is infallible, the consensus leans bullish, with many seeing gold eclipsing $5,500 by year-end, building on 2025’s explosive gains.
Bullish views dominate Wall Street’s narrative, driven by expectations of sustained demand. JPMorgan, a key player in commodities research, now projects gold reaching $6,300 per ounce by the end of 2026, citing “ongoing, unexhausted” reserve diversification and robust central bank purchases estimated at 800 tonnes annually.
This upgrade from earlier estimates underscores a structural shift away from fiat currencies. UBS echoes this enthusiasm, raising its target to $6,200 per ounce for March, June, and September 2026, before a modest pullback to $5,900 by December, with an upside scenario hitting $7,200 amid escalated tensions.
Goldman Sachs, while more measured, anticipates $5,400 by year-end, up from prior calls of $4,900, emphasizing de-dollarization and inflation hedges.
These projections align with BMO’s aggressive outlook of nearly $6,500 by end-2026 in a bull case, fueled by geopolitical flashpoints and ETF inflows.
On the conservative side, broader surveys temper the hype. A Reuters poll of 30 analysts and traders, conducted in early February 2026, yields a median forecast of $4,746.50 per troy ounce for the year, the highest in poll history but still implying a potential correction from current levels if risks subside.
This figure, up from $4,275 in October 2025, reflects upgraded expectations but highlights bearish scenarios like a hawkish Fed or resolved conflicts weakening safe-haven appeal.
Similarly, some institutions like HSBC and Goldman Sachs’ lower bounds suggest volatility could cap gains, with one analyst at a Sprott interview noting banks’ historical underestimation but cautioning on over-optimism.
Outliers push boundaries further, appealing to aggressive investors. CoinCodex’s algorithmic model predicts gold soaring to $10,262 by end-2026, a 99.7% jump from today’s $5,140, based on historical patterns and momentum indicators.
LongForecast offers a similarly bold view, seeing prices climb to $8,491 by December after hitting $6,780 midsummer, driven by long-term supply shortages and inflation persistence. These high-end calls contrast with mainstream views but gain traction in de-globalization narratives.
Scenario analysis provides a framework for navigating uncertainty. In a base case—assuming moderate economic slowdown, 2-3 Fed cuts, and steady central bank demand—gold could rise 5-15% from current levels, translating to $5,400-$5,900 by year-end, per World Gold Council models(WGC).
This scenario factors in ETF inflows offsetting jewelry demand weakness. A worst-case downturn, marked by recession signals, heightened conflicts, or AI market disruptions, might trigger a 15-30% surge to $5,900-$6,700, as investors flock to safe-havens amid equity volatility.
Conversely, a bullish economic rebound could lead to a 5-20% correction to $4,100-$4,900 if rates stabilize higher. These ranges emphasize monitoring key indicators like U.S. GDP data and geopolitical headlines.
To visualize the diversity, here’s a comparison table of forecasts from over 10 analysts and institutions, focusing on end-2026 or peak targets where specified:
| Institution/Analyst | Forecast Price (USD/oz) | Timeframe | Key Rationale |
|---|---|---|---|
| JPMorgan | $6,300 | End-2026 | Central bank buying, investor diversification |
| UBS | $6,200 (mid-year); $5,900 (end) | Q1-Q3; End-2026 | Geopolitical risks, Fed cuts; upside to $7,200 |
| Goldman Sachs | $5,400 | End-2026 | De-dollarization, inflation persistence |
| Reuters Poll (Median) | $4,746 | Annual Average | Balanced view amid uncertainties |
| CoinCodex | $10,262 | End-2026 | Algorithmic momentum model |
| LongForecast | $8,491 | End-2026 | Supply constraints, summer peak at $6,780 |
| BMO | $6,500 | End-2026 (bull case) | Geopolitical flashpoints, ETF flows |
| ANZ | $5,800 | Q2-2026 | Macroeconomic strength, volatility |
| TD Securities | $5,000 (avg); $5,455-$5,700 (peak) | Quarterly; Peak | Dollar weakness, Fed pivot |
| Westpac | $5,600 | End-2026 | Sustained macro case, broad commodity strength |
| Nicky Shiels (MKS Pamp) | $5,400 | End-2026 | Moderate gains post-rally |
| World Gold Council | $5,400-$5,900 (base); $5,900-$6,700 (surge) | End-2026 | Scenario-based on economic slowdown |
This table illustrates the bullish tilt, with most targets above current prices, but underscores the need for diversified strategies.

Investment Strategies Based on the Forecast
With gold poised to potentially exceed $6,000 per ounce in 2026 amid inflation pressures and geopolitical uncertainties, savvy investors should align their strategies to capitalize on this upside while mitigating risks.
Drawing from the bullish forecasts by JPMorgan ($6,300) and UBS ($6,200), the focus shifts to practical approaches that leverage gold’s safe-haven status.
Whether you’re a novice or seasoned trader, incorporating gold can enhance portfolio resilience, as evidenced by its 55% surge in 2025 driven by central bank demand and trade concerns.
How to Invest in Gold:
Several avenues offer exposure, each with unique benefits and considerations. Physical gold—bars, coins, or bullion—provides tangible ownership and acts as a direct hedge against currency debasement.
Purchase from reputable dealers like the U.S. Mint or authorized vaults, but factor in storage costs (e.g., 0.5-1% annually) and liquidity challenges.
For easier access, gold ETFs like SPDR Gold Shares (GLD) or iShares Gold Trust (IAU) track spot prices with low fees (~0.4%), allowing seamless trading via brokerage accounts.
These saw record inflows in 2025, amplifying returns without physical handling. Mining stocks, such as those in the VanEck Gold Miners ETF (GDX), offer leveraged upside—miners surged 120% year-to-date in 2025 as margins expanded with higher prices—but come with operational risks like production delays.
A balanced approach: Allocate 60-70% to ETFs for stability and 30-40% to miners for growth potential.
Risk Management:
Diversification is key; limit gold to 2-10% of your portfolio to avoid overexposure, as recommended by State Street Global Advisors’ analysis showing improved Sharpe ratios and reduced drawdowns in hypothetical blends from 2005-2025.
Hedge against inflation by pairing gold with equities or bonds, where its low correlation (under 0.2) shines during volatility. Monitor dollar strength and Fed policies; use stop-loss orders on mining stocks to cap losses at 10-15%.
Case Studies: Successful 2025 Strategies:
In 2025’s rally, conservative allocations proved triumphant. A hypothetical multi-asset portfolio adding 5% GLD from January yielded 15% higher risk-adjusted returns than one without, per SSGA’s backtesting, thanks to gold’s 40%+ gains offsetting stock dips amid Fed cuts.
Institutional investors like those tracked by VanEck benefited from miners’ 120% surge, with strategies emphasizing undervalued producers delivering 2x bullion’s appreciation, echoing 1970s patterns.
Retail success stories, such as OCM Gold Fund holders, capitalized on long-term holdings amid central bank buys, turning $10,000 investments into $15,500+ by year-end.
Explore gold IRAs for tax benefits—roll over retirement funds into self-directed accounts holding physical gold, deferring taxes while securing against economic shifts. Consult a financial advisor to tailor these strategies to your goals.
Potential Risks and Challenges in the Gold Market
While the 2026 gold outlook remains predominantly bullish, driven by central bank demand and geopolitical uncertainties, several bearish factors and structural challenges could temper gains or trigger corrections.
Investors must weigh these risks carefully to avoid overexposure, as gold’s recent volatility—marked by sharp swings in early 2026—highlights how quickly sentiment can shift.
1. Bearish Factors:
A stronger U.S. dollar (USD) poses one of the most immediate threats. Gold typically moves inversely to the USD, and any rebound—potentially fueled by resilient U.S. economic growth or hawkish Federal Reserve signals—could pressure prices downward.
Under Trump administration policies, successful fiscal stimulus, deregulation, or trade resolutions might accelerate growth, bolstering the dollar and reducing safe-haven appeal.
Analysts from the World Gold Council note that a “successful outcome” from these policies could lead to higher rates and a stronger USD, prompting a 5-20% correction in gold from current levels around $5,100/oz.
Recent market reactions show this dynamic: dollar strength has occasionally capped rallies, especially amid policy uncertainty.
2. Volatility from AI-Driven Trading:
Algorithmic and high-frequency trading, increasingly powered by AI, has amplified price swings in 2026. Gold experienced record volatility earlier this year, with one-week realized volatility exceeding 90% during speculative frenzies that pushed prices near $5,600 before sharp pullbacks.
Automated systems react instantly to news, sentiment, or technical signals, exacerbating intraday moves and creating “flash” corrections.
This environment challenges traditional buy-and-hold strategies, as positioning resets can lead to outsized drops unrelated to fundamentals. Reuters reports highlight how such volatility deviates from gold’s expected stability as a portfolio anchor.
3. Environmental and Regulatory Issues in Mining:
Supply-side pressures persist due to tightening regulations and environmental concerns. Global gold production growth is slowing, with ore grades declining and major mines maturing, potentially leading to plateaus or deficits by late 2026-2027.
Stricter ESG standards, including tailings management (GISTM) and the EU’s Carbon Border Adjustment Mechanism, raise compliance costs and delay new projects.
Permitting hurdles, community opposition, and decarbonization mandates further constrain output, with all-in sustaining costs (AISC) elevated.
These factors support higher long-term prices but could cause short-term supply disruptions if major producers face shutdowns or reduced expansion.
Balancing these risks, gold’s structural drivers like de-dollarization remain intact, but downside scenarios—such as rapid economic recovery or resolved tensions—could lead to meaningful pullbacks.
Monitoring USD movements, Fed policy, and mining developments is essential for navigating 2026 effectively.
Conclusion: Preparing for the 2026 Gold Boom
The gold market in 2026 stands at a pivotal juncture, with prices already firmly above $5,100 per ounce and momentum suggesting further upside.
Throughout this analysis, we’ve traced gold’s remarkable journey from the $1,500–$2,600 range in 2020–2024 to the explosive 65%+ surge in 2025, driven by persistent inflation, a weakening dollar, geopolitical flashpoints, record central bank purchases, and tightening mine supply.
Looking ahead, the consensus among leading institutions points to continued strength: JPMorgan targets $6,300 by year-end, UBS forecasts $6,200 mid-year with potential for $7,200 in high-tension scenarios, Goldman Sachs sees $5,400, and broader bullish calls from BMO and others push toward $6,500 or higher.
Even conservative estimates, such as the Reuters poll median of $4,746, reflect an upgraded outlook compared to prior years.
Structural drivers—ongoing de-dollarization, 2–3 expected Fed rate cuts, investor flight to safe havens amid stock volatility, and a looming supply deficit—underpin this bullish thesis, positioning gold to potentially surpass $6,000 and possibly test new all-time highs if uncertainties intensify.
Yet the path won’t be linear. Bearish risks, including a rebounding U.S. dollar, stronger-than-expected economic recovery under current U.S. policies, AI-amplified trading volatility, and mounting environmental/regulatory hurdles in mining, could trigger meaningful pullbacks.
Gold’s history shows it thrives in uncertainty but can correct sharply when sentiment shifts.
Final advice:
Stay proactive rather than reactive. Closely monitor central bank activity—watch monthly reserve announcements from major players like China, India, Turkey, and Poland—as these purchases have been the single most consistent tailwind.
Diversify your portfolio thoughtfully: maintain a 5–10% allocation to gold (via ETFs, physical holdings, or miners) to hedge inflation and equity downturns without overcommitting.
Rebalance periodically, especially after sharp rallies, and keep an eye on key macroeconomic indicators such as U.S. dollar index movements, Fed meeting outcomes, and geopolitical headlines.
The 2026 gold boom offers real opportunities for those prepared to act with discipline. Subscribe for updates on our gold market insights, price alerts, and emerging investment ideas delivered straight to your inbox.
Alternatively, consult a qualified financial advisor to tailor a strategy that aligns with your risk tolerance, time horizon, and overall financial goals. Gold has historically rewarded patience and informed positioning—2026 may prove no different.