
Gold Bar Market Trends: Supply, Demand & Prices Ultimate Guide 2026
As of March 4, 2026, gold prices have soared to over $5,161 per ounce, driven by persistent economic uncertainty, geopolitical tensions, and robust demand from central banks.
This remarkable surge in gold bar market trends highlights why investors are flocking to physical gold as a safe-haven asset amid volatile global markets.
In this comprehensive guide, we’ll explore the latest gold bar investment trends, from historical patterns to future forecasts, helping you navigate opportunities in buying and storing gold bars.
Gold bars, also known as bullion, differ from gold coins primarily in their form and purpose. While coins often carry numismatic value and are minted with intricate designs for collectors, gold bars are straightforward ingots of pure gold (typically 99.99% fineness), valued purely for their metal content.
They come in standard sizes like 1 oz, 10 oz, or 1 kg, making them ideal for large-scale investments. Unlike coins, which may include premiums for rarity, gold bars offer lower premiums over spot price, appealing to serious investors focused on wealth preservation.
The relevance of the gold bar market in today’s economy cannot be overstated. With inflation hovering around 4-5% in major economies and the U.S. dollar facing devaluation pressures, gold bars serve as a hedge against currency risks.
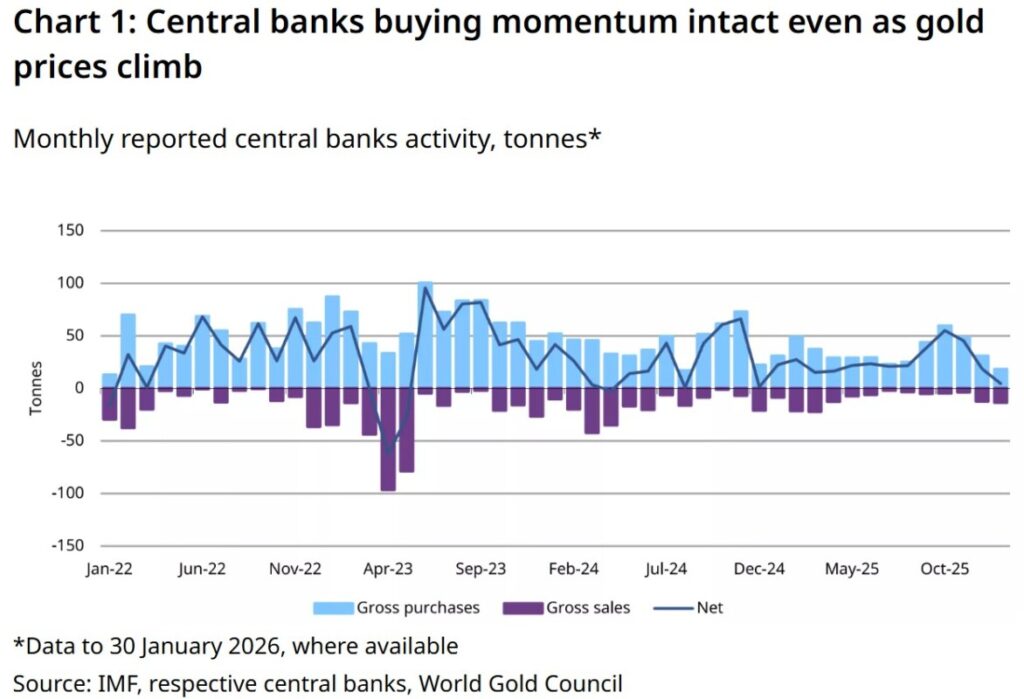
Central banks alone purchased an estimated 755 tonnes of gold in 2026, underscoring institutional confidence. Retail investors are also piling in, with bar and coin demand expected to exceed 1,200 tonnes annually.
This demand surge has propelled gold prices up 17.81% year-to-date in 2026, following a 65.24% gain in 2025.
Teasing the benefits of investing in gold bars: They provide tangible ownership, liquidity for quick sales, and portfolio diversification—historically, gold has outperformed stocks during recessions.
For instance, during the 2020 pandemic, gold rose 25% while equities plummeted. Whether you’re a beginner eyeing 1 oz bars or a high-net-worth individual stacking 1 kg ingots, understanding gold bar market trends can boost your returns and protect against downturns.
This article outlines key sections: a historical overview, current market analysis, influencing factors, future predictions, investment strategies, and a conclusion with FAQs. By the end, you’ll have actionable insights to capitalize on gold bar trends in 2026 and beyond.

Evolution of Gold as an Asset
Gold’s journey as an asset dates back to ancient civilizations, where it symbolized wealth and power.
From Egyptian pharaohs using gold bars in trade around 3000 BCE to the Roman Empire’s aurei coins, gold has been a cornerstone of economic systems.
The modern gold bar market evolved with the establishment of bullion standards in the 19th century, particularly the Gold Standard Act of 1900 in the U.S., which pegged currency to gold at $20.67 per ounce.
Key events shaped its trajectory: The 1933 Gold Reserve Act under Roosevelt devalued the dollar and confiscated private gold, boosting reserves.
Post-World War II, the Bretton Woods system fixed gold at $35/oz until the 1971 Nixon Shock ended convertibility, unleashing free-market pricing. This shift marked the beginning of gold’s volatility as an investment asset.
The 2008 financial crisis further cemented gold’s role, with prices spiking from $800/oz in 2007 to over $1,900/oz by 2011 as investors sought safety amid bank failures.
Today, gold bars represent a digitized yet physical hedge, with blockchain traceability enhancing trust in provenance.
Past Trends and Price Fluctuations
The 2010s showcased gold bar market stability amid recovery from the Great Recession. Prices averaged around $1,200-1,400/oz early in the decade, supported by steady ETF inflows and emerging market demand.
However, the 2020s brought dramatic surges: The COVID-19 pandemic drove prices from $1,770/oz in 2020 to highs of $2,693 in 2024, fueled by stimulus packages and inflation fears.
By 2025, averages hit $4,318/oz year-close, a 65% jump, as central banks ramped up purchases amid geopolitical strife.
Analyzing fluctuations: The 2013 taper tantrum saw a 28% drop, but rebounds followed. In contrast, 2022’s rate hikes caused temporary dips to $1,652/oz before climbing.
Gold bar trends in the 2020s reflect a bull market, with compound annual growth rates (CAGR) exceeding 15% from 2020-2025. To build authority, data from sources like the World Gold Council shows recycling rates stabilized at 1,100 tonnes annually, while mine output grew modestly.
Here’s a table of key historical data:
| Year | Average Price ($/oz) | Key Driver |
|---|---|---|
| 2020 | 1,770 | Pandemic uncertainty |
| 2023 | 1,944 | Inflation hedges |
| 2025 | 3,448 | Geopolitical tensions |
| 2026 (Q1) | 5,087+ | Central bank demand |
This illustrates the upward trajectory in gold prices, making bars a reliable long-term hold.

Current Gold Bar Market Analysis
Supply and Demand Dynamics
In the evolving gold bar market trends of 2026, supply dynamics remain tight amid robust global demand. Global mine production hit a record 3,672 tonnes in 2025, with projections for modest growth in 2026 driven by key producers.
China leads as the top gold producer at approximately 380 tonnes annually, followed by Russia at 310 tonnes and Australia at 290 tonnes.
Other major contributors include Canada (200 tonnes) and the United States (160 tonnes), accounting for over 40% of worldwide output. These figures highlight a concentrated supply base, vulnerable to geopolitical disruptions in regions like Russia.
Recycling rates, a key secondary supply source, increased 3% to 1,404 tonnes in 2025 but remain relatively muted despite high prices, as gold is increasingly held as collateral or in reserves.
Analysts anticipate potential swings in 2026 recycling, possibly rising if economic downturns force liquidations. On the demand side, total gold demand (including OTC) exceeded 5,000 tonnes in 2025, setting a record.
Central banks are pivotal, with 2026 purchases forecasted at 750-900 tonnes, broadening beyond traditional buyers like China and Turkey to include emerging markets for diversification.
January 2026 saw net buys of just 5 tonnes, but quarterly averages could hit 190 tonnes, underscoring sustained institutional appetite. This imbalance—steady supply versus surging demand—supports upward pressure on gold bar prices.
Price Trends in 2026
Gold prices in 2026 have exhibited remarkable volatility, influenced by Federal Reserve policies, geopolitical tensions, and investor sentiment.
As of March 4, 2026, the spot price hovers around $5,168 per ounce, up 1.5% from the prior day but down from January’s all-time high of $5,608 per ounce.
This follows a surge past $5,000 in early January, peaking at $5,589 amid Middle East escalations, before a pullback driven by a stronger U.S. dollar and shifting rate expectations. Year-to-date, prices have risen over 8% from December 2025 closes around $4,744, reflecting a 77% annual gain.
Fed easing signals, including potential rate holds amid inflation from energy shocks, have introduced swings—gold dipped to $5,050 in early March before rebounding to $5,189 intraday on March 4.
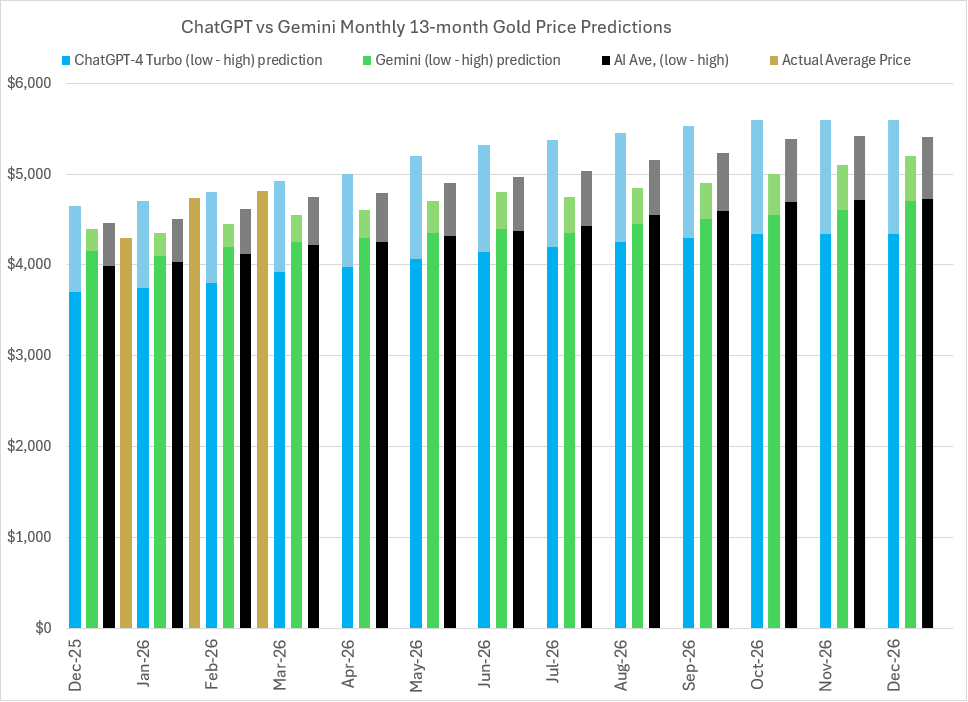
Analysts like J.P. Morgan forecast averages of $5,055 for Q4 2026, with bullish scenarios reaching $6,300 by year-end if central bank demand persists.
Chart analysis reveals a bullish uptrend: The 2026 YTD price chart shows a sharp January spike, February consolidation around $5,100-$5,300, and March volatility with support at $5,000.
Key resistance lies at $5,400, with moving averages (50-day at ~$5,200) confirming momentum. This pattern underscores gold bar investment trends favoring long-term holds amid uncertainty.
Regional Market Insights
Gold bar market trends vary significantly by region, reflecting cultural, economic, and investment preferences. In the US and Europe, focus leans toward investment, with US demand doubling to 679 tonnes in 2025, primarily via ETFs and bars for portfolio diversification.
European holdings remain below historical peaks, offering growth potential as investors seek hedges against euro volatility and geopolitical risks. Smaller 1-ounce bars dominate here for liquidity and ease of storage, appealing to retail investors amid high prices.
In contrast, Asia and India emphasize jewelry and larger bars, driving over 60% of global demand. India’s 2026 demand may dip to 600-700 tonnes from 710.9 tonnes in 2025, with jewelry slumping 24% due to elevated prices, offset by a 17% rise in investment demand to 280 tonnes—now 40% of total consumption.
China and broader Asia see robust bar and coin buying, fueled by economic growth and de-dollarization. Popular sizes include 1-kilogram bars for high-value storage and cultural gifting, especially in India during festivals.
- US/Europe Pros: High liquidity, ETF-driven; Cons: Lower physical demand.
- Asia/India Pros: Cultural affinity, volume; Cons: Price sensitivity.
This regional divergence highlights opportunities: Western investors favor gold bars for wealth preservation, while Eastern markets blend tradition with hedging.

Factors Influencing Gold Bar Trends
Economic and Geopolitical Drivers
In 2026, gold bar market trends are profoundly shaped by macroeconomic pressures and global instability, propelling gold prices to new heights around $5,000–$6,000 per ounce.
Persistent inflation, hovering at 4-5% in major economies, erodes fiat currency value, making gold bars a preferred hedge.
The U.S. Federal Reserve’s easing cycle, with rate cuts anticipated to continue amid a weakening dollar (down 6-7% in recent years), reduces the opportunity cost of holding non-yielding assets like gold bullion.
A softer dollar enhances gold’s appeal for international buyers, as evidenced by its inverse correlation—gold often rises when the DXY index falls below 100.
Geopolitical tensions amplify this dynamic, boosting gold’s safe-haven appeal. Ongoing conflicts, such as Russia’s invasion of Ukraine, Israel-Palestine escalations, and threats of a China-Taiwan crisis, have driven institutional flight to safety.
Trade wars, including U.S. tariffs under the Trump administration, disrupt supply chains and fuel de-dollarization efforts, with countries like China recycling U.S. Treasuries into physical gold.
Fiscal instability, with U.S. debt exceeding $39 trillion, further undermines confidence in paper currencies, positioning gold bars as a reliable store of value.
These factors converge to support bullish gold price forecasts: J.P. Morgan predicts $5,000/oz by Q4 2026, with upside to $6,000 in downturns. Investors should monitor:
- Inflation metrics (e.g., U.S. CPI above 3%).
- Fed policy shifts.
- Geopolitical flashpoints, like Middle East tensions.
This environment underscores why gold bar investments thrive amid uncertainty, with prices up 17-18% year-to-date in early 2026.
Investor Behavior and Institutional Demand
Gold bar trends in 2026 reflect surging investor appetite, driven by portfolio diversification and institutional inflows.
Retail and high-net-worth individuals are allocating 5-10% to gold bars as insurance against volatility, with bar demand (1oz and 1kg sizes) spiking in Asia and India due to cultural affinity and economic hedges.
Young buyers favor innovative formats like bean-shaped bars, sustaining robust retail demand despite high local prices.
Institutions dominate, with gold ETFs recording record inflows: $19 billion in January 2026 alone, pushing global AUM to $669 billion and holdings to 4,145 tonnes—all-time highs.
North America leads with eight months of consecutive inflows ($7 billion in January), while Asia (China, India) adds $7.1 billion in precious metals ETFs.
Central banks remain pivotal, averaging 585 tonnes per quarter in purchases, with 2026 projections at 755-800 tonnes—down from 2025’s 863 tonnes but still elevated.
Emerging markets broaden the base, with January net buys at 5 tonnes despite a slower start. This de-dollarization trend, led by China (15th straight month of buys), tightens physical supply.
Investor psychology favors gold bars over equities in uncertain times, with correlations to stocks/bonds rising, prompting reallocation from $7.5 trillion in money market funds.
Technological and Environmental Impacts
Advancements in technology and sustainability are reshaping gold bar market trends, enhancing efficiency and appeal. Blockchain traceability ensures ethical sourcing, allowing buyers to verify gold bars from mine to market, boosting consumer trust amid ESG scrutiny.
By 2026, global production efficiency is projected to rise 20% through AI-driven exploration and automated mining, reducing costs by 10-25%.
Environmental trends focus on sustainable mining: Zero-emission machinery and renewables could cut CO₂ emissions by 60%, with water usage dropping 80% via closed-loop systems.
California’s industry targets 30% impact reduction, while global ESG adoption rises to 28-31% for innovations like bioremediation.
Recycling rates stabilize at 1,100-1,200 tonnes annually, easing supply pressures. These shifts make gold bars more attractive to eco-conscious investors, potentially increasing demand.
Risks and Challenges
Despite bullish gold bar trends, risks persist. A strengthening U.S. dollar (potentially up 60% in bear scenarios) could pressure prices, as gold often falls with DXY rises.
Crypto competition, with Bitcoin viewed as “digital gold,” diverts speculative flows, though quantum risks may favor physical gold bars long-term.
Volatility remains high, with no yield generation adding opportunity costs if rates rise.
- Pros: Strong liquidity, inflation hedge, safe-haven status.
- Cons: Storage costs, crypto rivalry, dollar sensitivity.
Future Predictions for Gold Bar Markets
The gold bar market stands at a pivotal juncture in 2026, with prices already exceeding $5,100/oz amid sustained bullish momentum.
Looking ahead to 2030, forecasts from leading analysts point to continued upward pressure on gold prices, driven by structural demand shifts, reserve diversification, and persistent macroeconomic uncertainties.
Physical gold bars—as tangible bullion—remain a core component of this outlook, offering direct ownership without counterparty risk in an era of rising geopolitical and financial instability.
2026-2030 Forecasts
Analyst projections for gold prices in the coming years reflect a firmly bullish consensus, with gold bar demand expected to play a key role in sustaining gains.
- Base case for 2026: Prices average around $4,500–$5,500/oz, with year-end targets clustering between $5,000 and $5,400/oz. J.P. Morgan forecasts an average of $5,055/oz by Q4 2026, rising toward $5,400/oz by end-2027, citing ongoing central bank and investor diversification.
- Bullish scenarios see prices pushing higher: J.P. Morgan highlights potential for $6,300/oz by end-2026 if demand from central banks (projected at 60+ tonnes/month) and investors accelerates amid economic slowdowns or further Fed easing. Goldman Sachs targets $5,400/oz by December 2026, while other models (e.g., from Reuters compilations) show upside to $6,300+ in stress cases involving renewed inflation or geopolitical escalation.
Beyond 2026, the trajectory strengthens: Many forecasts anticipate $6,000–$8,000/oz by 2027–2028 in optimistic paths, with longer-term views reaching $8,000–$15,000/oz by 2030 if de-dollarization and reserve rebalancing intensify.
For gold bars specifically, physical demand in emerging markets (including Africa) supports this, as investors favor tangible assets over paper proxies during volatility.
These predictions underscore gold’s role as a multi-year bull market asset—gold bar investors in Uganda and beyond can position for substantial appreciation by accumulating during any near-term consolidations.
Market Growth Projections
The broader gold bullion market—encompassing physical gold bars and related products—is poised for robust expansion through 2033.
Recent industry reports project a CAGR of 11.2% from 2026–2033, with market value rising from approximately $73 billion in 2025 to over $171 billion by 2033 (SkyQuest Technology).
Other analyses align closely: precious metals segments show 8.9% CAGR to 2030 (Grand View Research), while volume-based forecasts indicate steady tonnage growth driven by investment and reserve needs.
Physical gold bullion (bars and coins) outperforms in key areas compared to digital gold alternatives. While tokenized or app-based digital gold offers convenience, low entry barriers, and instant liquidity—appealing to younger, tech-savvy investors—physical gold bars dominate for long-term wealth preservation.
They provide no counterparty risk, full ownership, and proven performance during crises (e.g., no reliance on platforms or blockchain stability). In regions like East Africa, cultural preference and distrust of digital systems further favor physical holdings.
Digital gold grows rapidly in urban markets but faces challenges like storage fees (avoided in physical) and regulatory risks. By contrast, gold bars benefit from enduring demand in jewelry, reserves, and hedging—central banks alone add hundreds of tonnes annually.
Overall, physical bullion’s structural advantages position it to capture a larger share of growth, especially as global uncertainties persist into the late 2020s and beyond.
Investment Strategies and Tips
Investing in gold bars requires a thoughtful approach to maximize returns while minimizing risks, especially in Uganda’s dynamic market.
With gold prices exceeding $5,100 per ounce in March 2026 and strong local demand fueled by the Bank of Uganda’s new gold-buying program, now is an opportune time for strategic accumulation.
Below are practical strategies tailored for both novice and experienced investors.
How to Buy and Store Gold Bars
Purchasing gold bars in Uganda starts with selecting reputable, licensed dealers to ensure authenticity and compliance. Look for government-registered suppliers offering assayed 24k gold bars (99.99% purity) with certificates.
Premiums typically range from 1-5% over spot price for larger bars (e.g., 1 oz or 1 kg), though smaller sizes may carry higher markups due to fabrication costs. In Kampala, avoid unregulated sources—always verify purity via independent assays.
Gold Buyers Africa, a trusted Kampala-based dealer, provides competitive pricing on high-quality gold bars, full documentation, and secure transactions for local and international buyers.
Visit Gold Buyers Africa to explore options and place orders today—secure your hedge against inflation with confidence.
For storage, prioritize security: Home options include fireproof safes bolted to the floor in cool, dry locations, using airtight capsules or tubes to prevent tarnish.
For larger holdings, opt for professional vaults or insured depositories offering 24/7 surveillance and full coverage against theft or loss. Bank safe-deposit boxes provide convenience but limited insurance—specialized precious metals vaults are often safer and more reliable.
Portfolio Integration
Incorporating gold bars into your portfolio enhances diversification and acts as a hedge against volatility, inflation, and currency risks—particularly relevant in 2026 amid global uncertainties.
Experts recommend allocating 5-10% of your total portfolio to physical gold, with conservative investors leaning toward 10% for stronger wealth preservation.
For example, in a balanced portfolio, replace part of bonds or equities with gold to improve risk-adjusted returns, as historical data shows gold outperforming during downturns.
Timing buys is key: Purchase during price dips or consolidation phases rather than chasing highs. Monitor factors like central bank purchases (e.g., Uganda’s initiative) and Fed policies for entry points. Rebalance annually to maintain your target allocation—sell portions if gold exceeds 15% due to rallies.
Start small with 1 oz bars for liquidity, scaling to 1 kg for cost efficiency. Gold bars offer tangible ownership without counterparty risk, complementing stocks, real estate, and other assets for long-term stability.
Frequently Asked Questions
Is now a good time to buy gold bars?
Yes—prices remain in a strong uptrend with institutional demand still accelerating. Buying during consolidation phases offers excellent entry points.
What is driving gold prices higher in 2026?
Central bank purchases, inflation protection, geopolitical risks, and lower interest rates are the primary catalysts.
How much of my portfolio should I allocate to gold bars?
Financial experts recommend 5–10% for diversification and inflation hedging, with conservative investors often targeting the higher end.
Are gold bars better than gold coins for investment?
Yes—for pure wealth preservation, gold bars typically carry lower premiums over spot price and are easier to store and sell in bulk.
Where can I safely buy gold bars in Uganda?
Choose licensed, reputable dealers like Gold Buyers Africa in Kampala, which provides assayed 24k bars, full documentation, and secure transactions.
How should I store my gold bars?
Use a home fireproof safe for smaller amounts or professional insured vaults/bank safe-deposit boxes for larger holdings to protect against theft and damage.
Will gold continue to rise in the coming years?
Most analysts project continued strength through 2030, with bullish scenarios targeting $6,000+ per ounce if global uncertainties persist.
Ready to start? Contact Gold Buyers Africa today and secure your position in this historic gold bull market.
Conclusion
The gold bar market trends in 2026 paint a compelling picture: prices have surged past $5,100 per ounce, fueled by relentless central bank buying (over 750 tonnes projected this year), persistent inflation, geopolitical uncertainty, and growing retail demand across Africa and beyond.
Physical gold bars continue to shine as a reliable hedge against currency devaluation and economic volatility—outperforming many traditional assets during periods of stress.
For investors in Uganda and the region, this bull market offers a clear window to protect and grow wealth. Whether you’re building a starter position with 1 oz bars or scaling up to 1 kg ingots, acting strategically now positions you ahead of further upside forecasts that see gold reaching $5,500–$6,300 by year-end or into 2027.
Don’t wait for the next spike—secure your gold bars today. Visit Gold Buyers Africa, your trusted Kampala partner for authentic, certified bullion at competitive rates. Take control of your financial future—buy now and hedge with confidence.